Project Automation: Earned Value Management & Analysis
Automated Performance Insights for Project Success
Traditional Earned Value Management (EVM) requires extensive manual effort, making it difficult to track cost and schedule performance accurately.
PlanAutomate revolutionizes EVM by automating data collection, calculations, and reporting—providing real-time insights into project performance without all the manual input.

Eliminate Data Silos and Automate EVA with a Unified System
To achieve accurate Earned Value Analysis (EVA), you need to answer two critical questions: Are we on time? Are we on budget? Too often, these metrics are tracked in separate systems, leading to delays, errors, and inefficiencies.
With PlanAutomate, EVA is fully integrated into a single system—ensuring real-time data accuracy, transparency, and auditability.
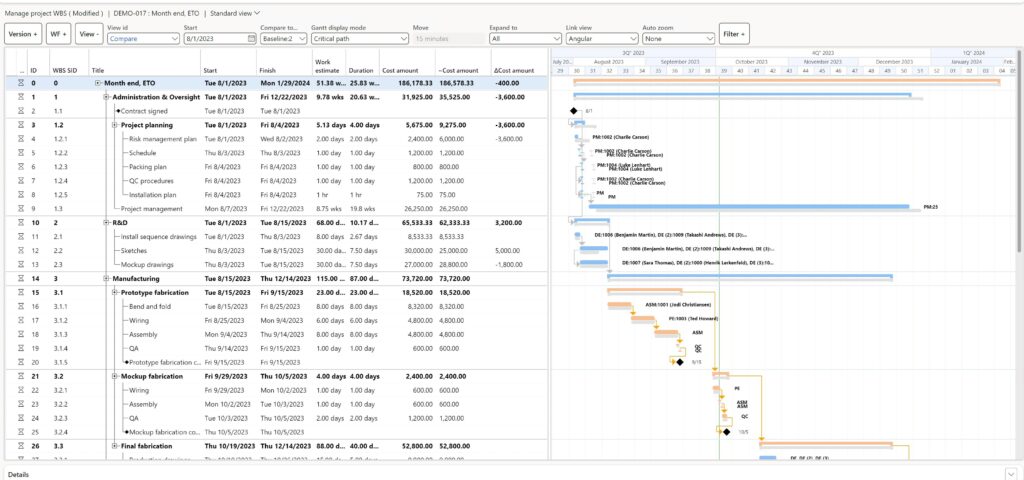
Time-Phased Cost Analysis
- Automatically align cost budgets with project schedules.
- Apply Work Breakdown Structure (WBS) timelines or distribution curves to the Cost Breakdown Structure (CBS).
Single Source of Truth
- Costs are recorded directly within the native CBS.
- No need for manual data translation, imports, or mapping—EVA calculations are automated and seamless.
Built-In Trend Analysis & Forecasting
- Continuously monitor financial and operational performance.
- Automatically lock down progress at month-end for precise earned value calculations.
- Store EVA datasets for long-term trend analysis and forecasting.
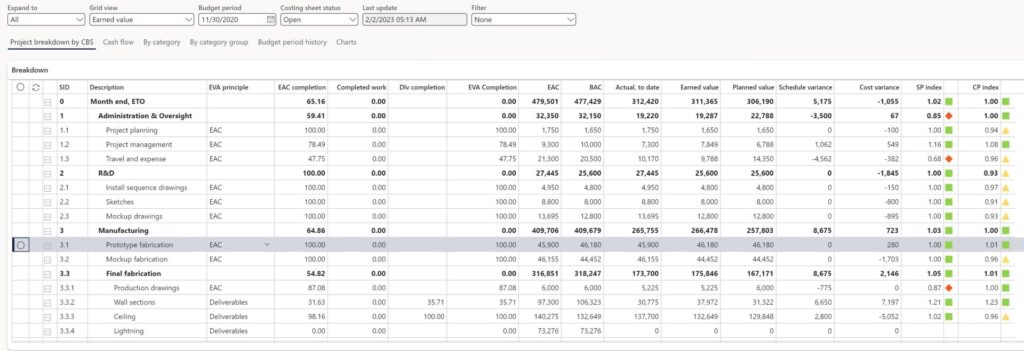
Earned Value Analysis Key Capabilities
The base EVA configuration is done against the CBS. The configuration includes a definition of the CBS level at which earned value is computed and which EVA principles are used to drive earned value computations. Supported EVA principles include:
- Estimate at Completion (EAC)
- Completed work
- Deliverables
- Production units
- Physical inspection
The detailed EVA view reports earned value metrics for each defined EVA level in the CBS. The detailed view also includes the Schedule Performance Index (SPI) and Cost Performance Index (CPI) along with cost and schedule variances accompanied by sensor points™ to highlight extreme metrics.
The S-Curve presentation provides a project level summary of planned value, earned value and actual costs for all preceding and future periods. This is the manager’s level view of how projects are performing.

Using resource progress reporting, automatically update remaining work status, and the overall project completion percentage is updated, including percent complete, cost-to-complete, and revenue-at-completion.
Ready to talk about project automation?
Reach out to us today to schedule a consultation.
Get Started