
Power BI Project Management Dashboard
Real-time project management insight
Power BI project management dashboards embedded in Dynamics 365 give you real-time analytics and insight into your business.
PlanAutomate brings leaders of project-driven companies the real-time project business intelligence they need to transform their companies into high-performing enterprises in their industry.

End-to-end Project Intelligence
Single Source of Truth
PlanAutomate manages all your project processes, presenting unified data across all projects, departments, and legal entities.
Real-Time Monitoring
Live dashboards and reports to track project performance, cost, and schedule health.
Automated Data Collection
Eliminate manual reporting errors and delays.
Customizable Dashboards & KPIs
Define key metrics that matter to your business, including earned value, financial forecasts, and risk exposure.
Why PlanAutomate’s Analytics Matter
Project-driven organizations need real-time visibility to stay competitive. Traditional project management tools provide fragmented data, leading to reactive decision-making and missed opportunities. PlanAutomate is able to manage all your project processes in the same system and therefore provide you with:
- Faster, more accurate decision-making
- Proactive risk management
- Optimized resource utilization
- Stronger financial control
With PlanAutomate, you gain full visibility and control over your projects and portfolio—turning data into a competitive advantage.

PlanAutomate Project Analytics Key Capabilities
Every aspect of your projects is constantly monitored, automatically alerting you to any crucial deviations.
Sensor Points track configurable KPIs, and Project Autopilot notifies the right personnel at the right time with automated escalation.
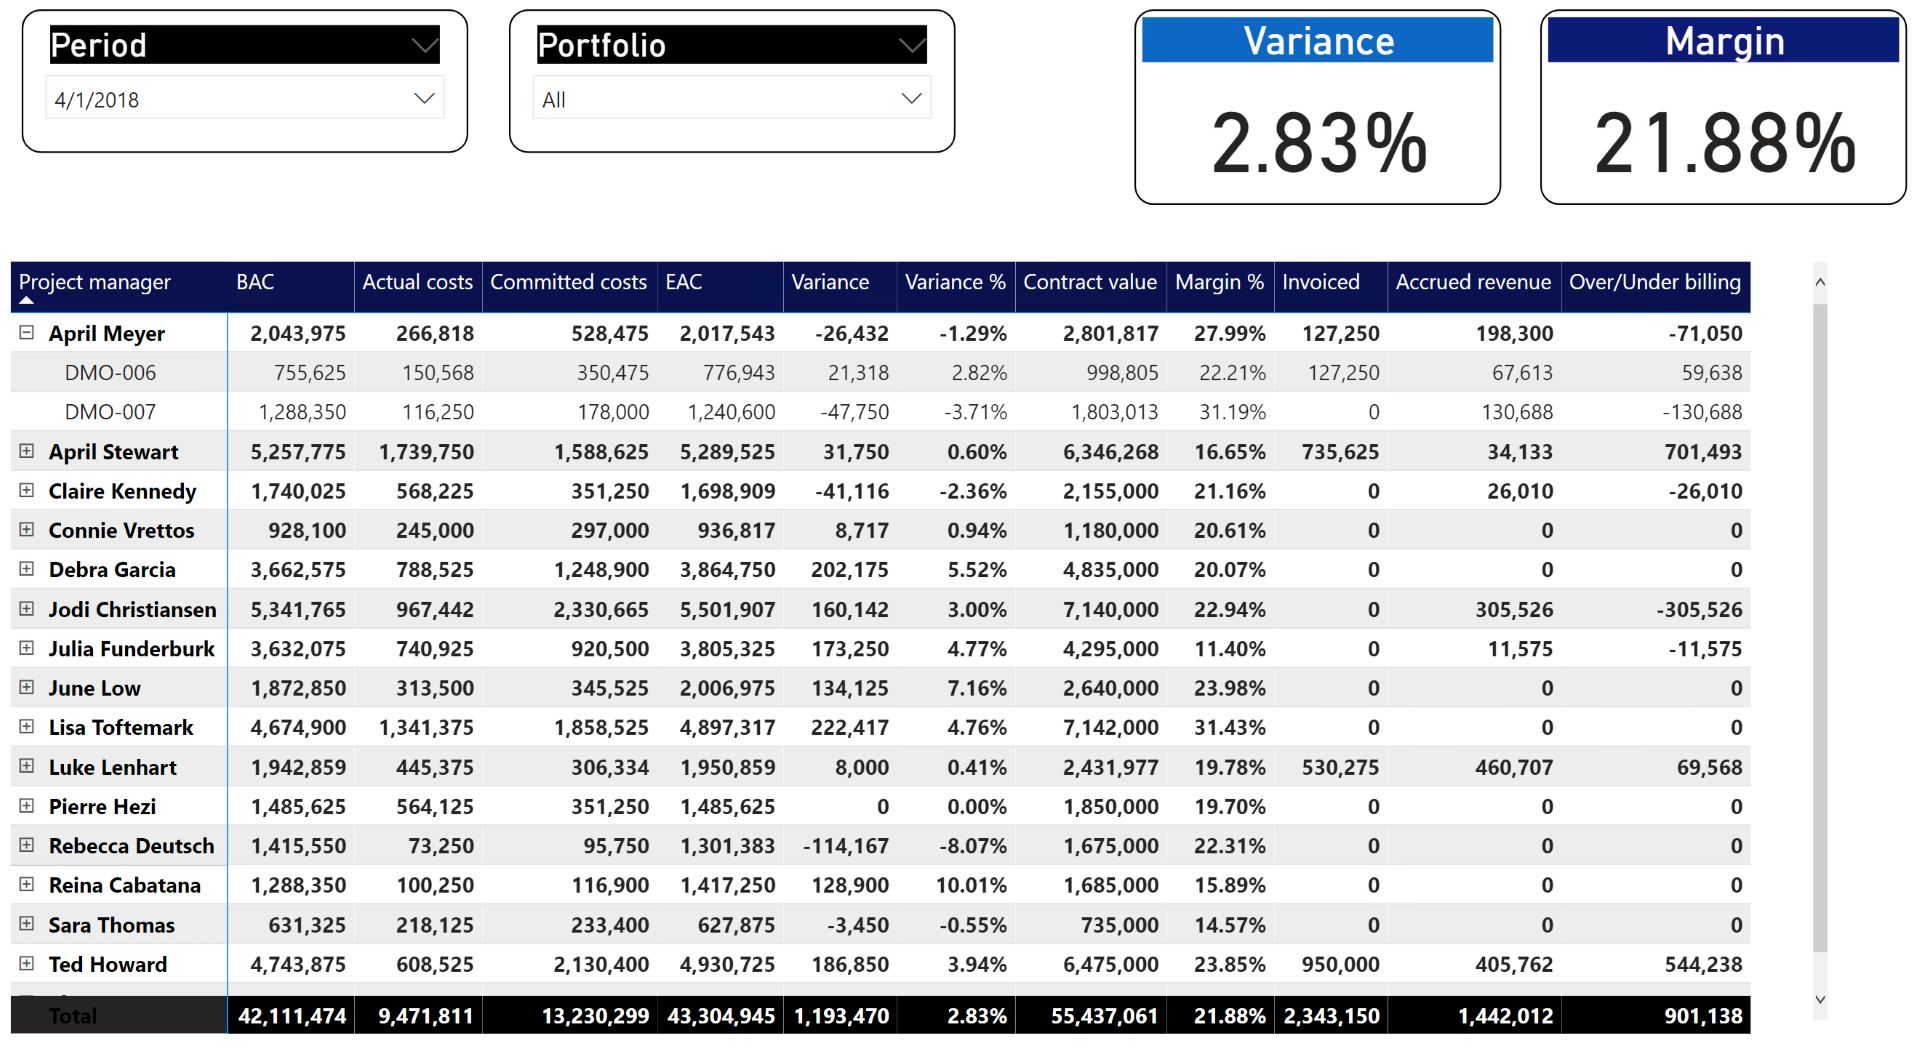
Track key financial metrics like variance, profitability, and cash flow across all projects.
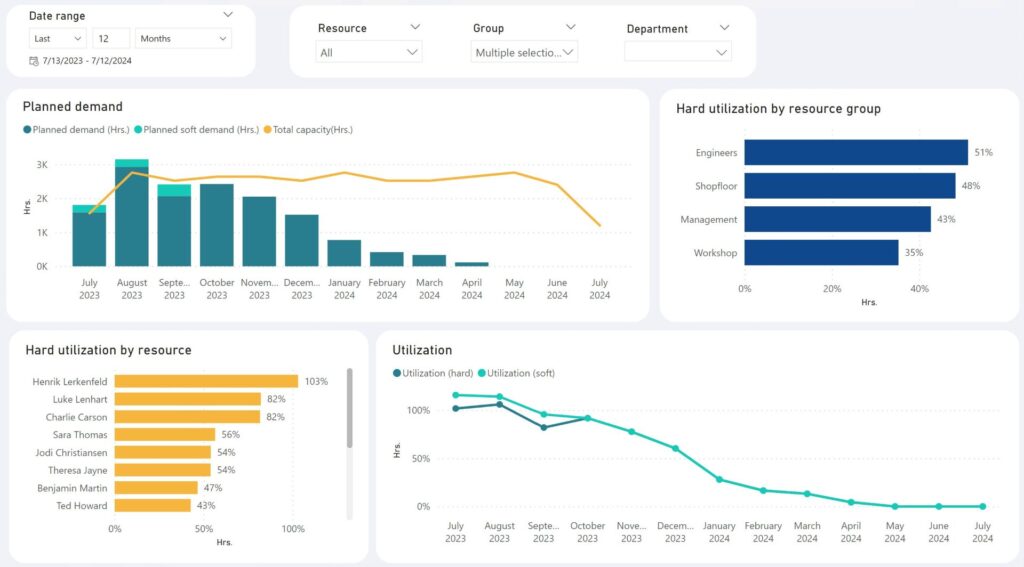
Align resource availability with project demand for better planning and maximum utilization.
With native Power BI reporting capabilities built in, PlanAutomate provides interactive dashboards that turn complex project data into clear, actionable insights.
- Custom Reports – Tailor analytics to your unique business needs.
- Drill-down capabilities – Instantly explore project details from a high-level portfolio view.
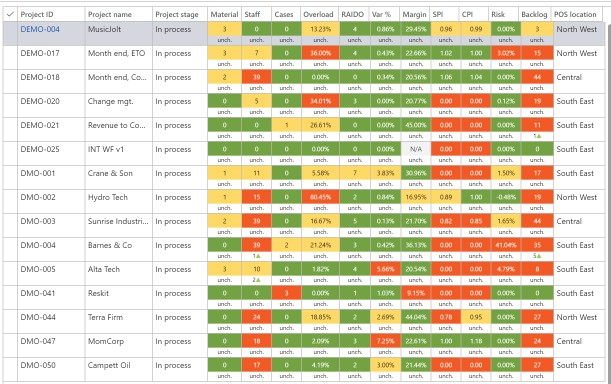
Example Power BI Dashboards
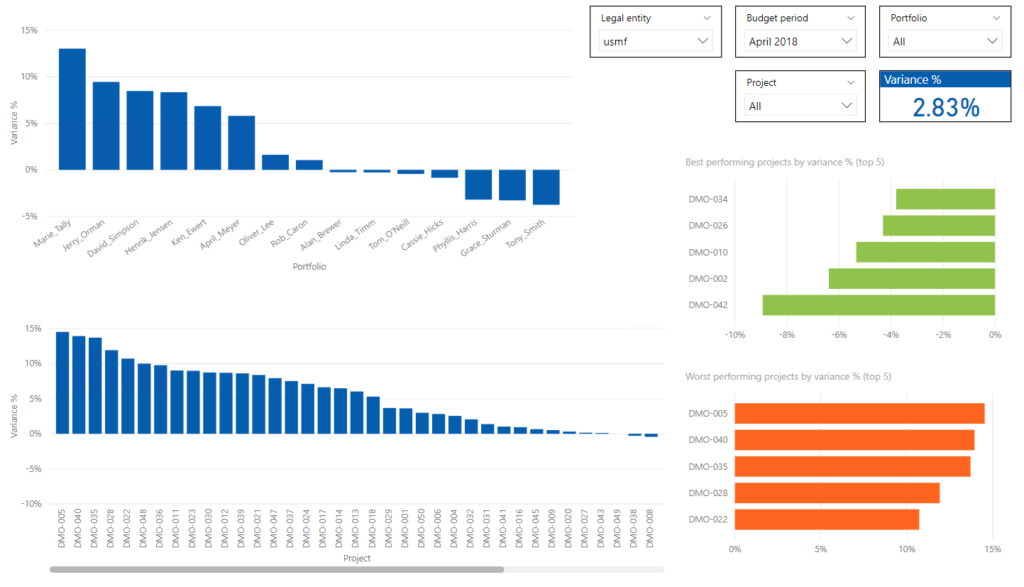
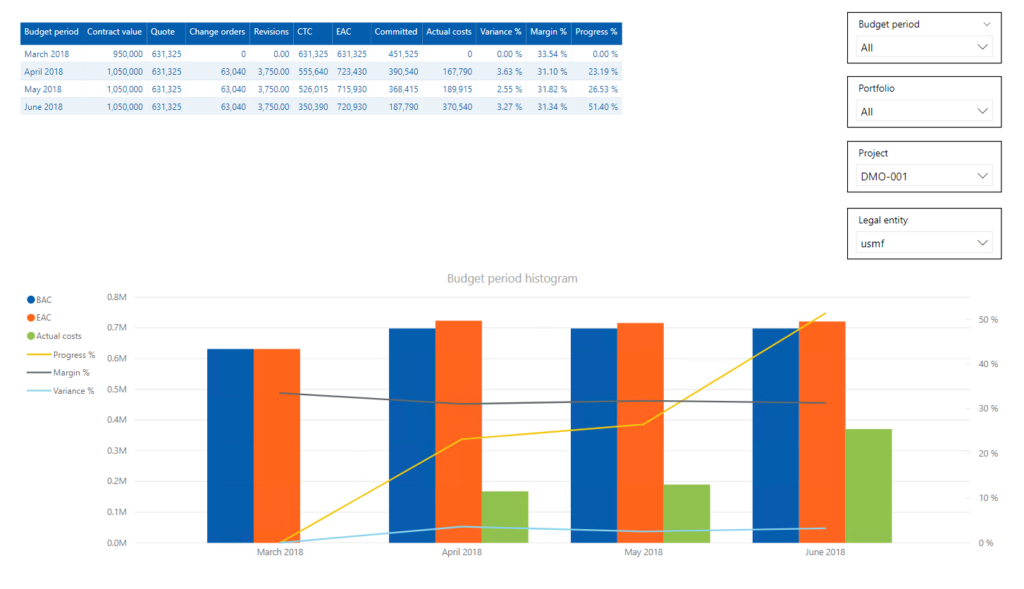
Variance Analysis
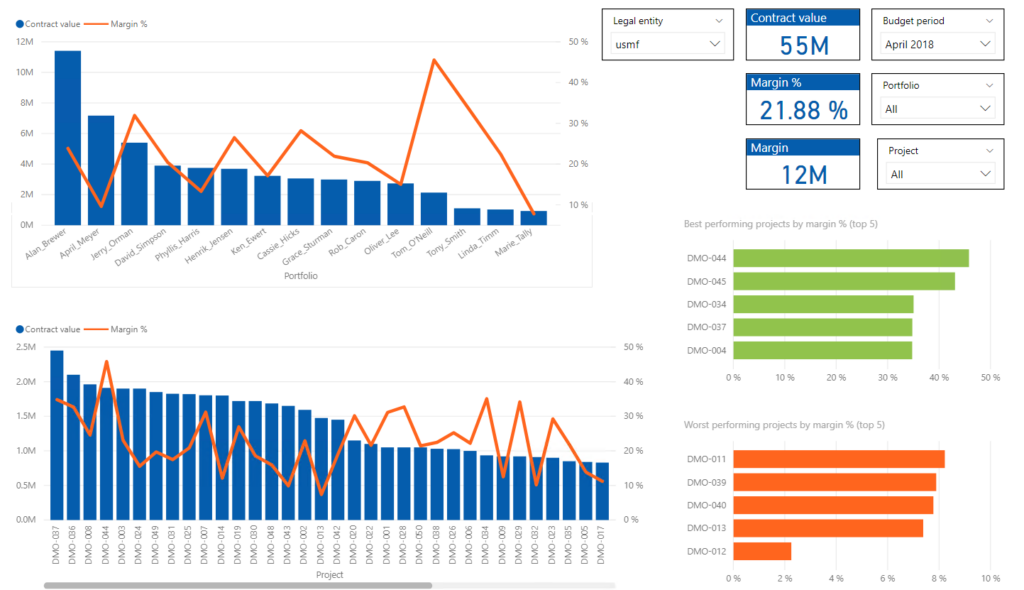
Margin Analysis
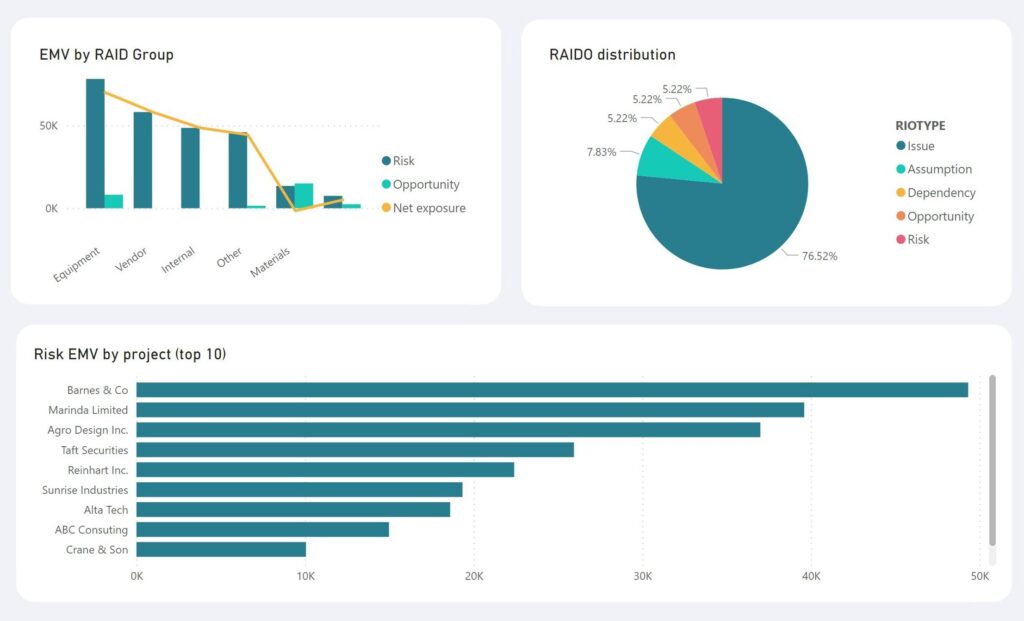
Risk & Issue Analysis
Budget Performance

Ready to talk about project automation?
Reach out to us today to schedule a consultation.
Get Started